
This is Part 2 of our Gold Series. Read Part 1: Why Gold Prices Are Crashing Despite Inflation →
In Part 1, we dissected why gold is crashing even as inflation runs hot. The answer wasn’t the inflation itself — it was the Fed’s interest rate policy fighting it. Now comes the natural follow-up: With gold down 20% from its all-time high, is this a buying opportunity or a trap? And where exactly is “smart money” flowing in this high-rate environment?
No investment advice here. Just cold, hard data — and we’ll let the experts do the recommending.
📊 Fact Check: What Are the Big Institutions Saying About Gold in 2026?
“Experts are always wrong” — sure. But ignoring all institutional data is arguably more dangerous. Here’s what the major financial institutions are projecting:
| Institution | 2026 Gold Forecast (per oz) | Key Assumption |
|---|---|---|
| J.P. Morgan | $5,055 avg (Q4), up to $5,300 | Fed rate cuts + ETF inflows |
| Goldman Sachs | Potential to reach $6,200 | Severe global economic slowdown |
| World Gold Council | +15% to +30% upside possible | Recession materializes + rate cuts |
| Current Spot Price | ~$4,438 (Mar 2026) | Ongoing pressure from higher-for-longer rates |
Sources: J.P. Morgan Research, Goldman Sachs, gold.org, Trading Economics (March 2026)
The common thread across all projections is simple: the moment the Fed pivots and starts cutting rates, gold is expected to recover — and fast. The question that no one can answer with certainty is: when?
🏦 The Asset Map: Where Money Is Competing in 2026
In a high-rate world, every asset class is fighting for investor dollars. Here’s how gold stacks up against the competition — with the real risks, not the marketing pitch:
| Asset | Return (2026 Est.) | The Real Risk (No Sugar-Coating) |
|---|---|---|
| 🏛️ Short-Term T-Bills (3M) | ~3.64% annualized | Safe if held to maturity. Sell early and you face market price risk based on rate movements. |
| 📉 Long-Term Treasuries (10–30yr) | 4–5% coupon | A 1% rate hike = ~10–20% price drop. Long bonds are essentially a leveraged bet on the direction of rates. Not “safe” in any short-term sense. |
| 🏦 High-Yield Savings / CDs | 3–4%+ | FDIC insured up to $250k. Watch for liquidity lock-up periods. |
| 📈 S&P 500 ETF | Hist. avg. 11.45%/yr | Sharp drawdowns guaranteed. 2022: -19.4% in one year. Long-term only. |
| 🏢 REITs | Dividend + capital gains | Rate-sensitive to the extreme. Get crushed when rates rise; first to rocket when rates fall. |
| 🪙 Gold | -20% short-term; bullish long-term | Zero yield. Zero dividends. Entirely policy-driven. But structurally supported by central bank buying. |
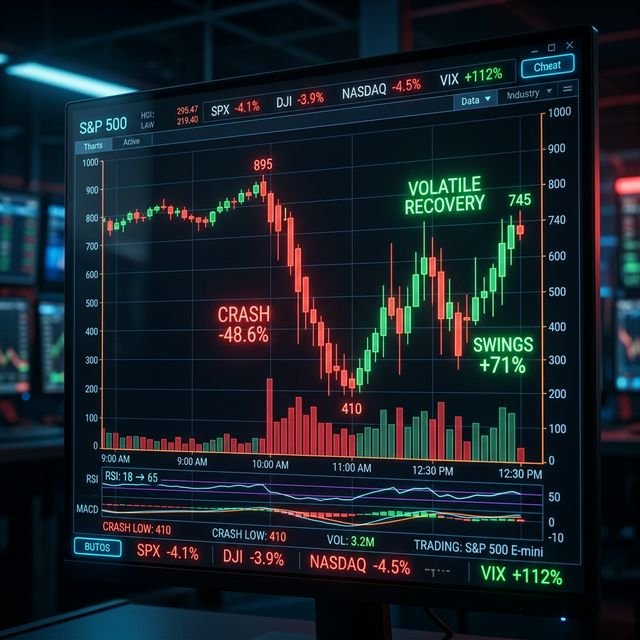
Every asset class — stocks, bonds, gold — is subject to the violent swings seen in this chart. “Safe” is relative.
🔍 The U.S. Treasury Myth: “Aren’t Bonds Just Safe?”
This is one of the most common misunderstandings in personal finance, and it needs to be killed with data.
- Credit Risk: The U.S. government defaulting = essentially zero probability. ✅ Safe here.
- Interest Rate Risk: When market rates rise by 1%, the market price of a 10-year Treasury bond drops approximately 8–10%. A 20-year bond? Try 15–20% down. If held inside an ETF or mutual fund, this loss is real and immediate.
- The takeaway: Short-term T-bills held to maturity = genuinely low risk. Long-term bonds = interest rate speculation in a government suit.
📊 Visual: How Rate Changes Destroy Long Bond Prices
Bond Price
(Rates Unchanged)
10yr Bond
(+1% Rate Hike)
30yr Bond
(+2% Rate Hike)
* Illustrative approximation based on bond duration math. Actual results vary.
🌍 The Biggest Buyers Nobody Talks About: Central Banks
While retail investors debate their next move, the world’s central banks have already made theirs. In 2025 and into 2026, global central bank gold purchases have reached their fastest pace since the 1960s.
The driving force? De-dollarization. Nations including China, India, Russia, and Turkey are systematically converting a portion of their U.S. dollar foreign reserves into gold. This is a structural, multi-year trend — not a quarterly trade.
What does this mean for prices? Even when institutional and retail investors sell, state-level buying provides a structural price floor. It’s one of the core reasons major banks remain bullish on gold’s long-term trajectory despite short-term volatility.
📈 What History Says: Gold After Every Fed Rate-Cut Cycle
| Fed Rate-Cut Cycle | Rate Cut Began | Gold 12-Month Return After |
|---|---|---|
| Dot-com Recession | January 2001 | +24% |
| Global Financial Crisis | September 2007 | +35% |
| Pre-COVID Insurance Cuts | July 2019 | +36% |
Sources: World Gold Council, U.S. Federal Reserve official data
The pattern is remarkably consistent. Every time the Fed has pivoted from tightening to cutting, gold has delivered double-digit returns in the following 12 months. Whether history repeats is always uncertain — but this is the data-driven thesis behind every institutional bull case for gold in 2026.
💬 What Certified Experts Are Saying (So You Don’t Have to Take Our Word for It)
“Gold should be understood not as an investment vehicle, but as portfolio insurance. Allocating beyond 5–15% of a total portfolio dilutes its diversification benefit.”
— consensus view across multiple Certified Financial Planners (CFP) and institutional research reports
“Pairing short-duration T-bills with a modest gold allocation represents a defensible positioning during periods of elevated rate uncertainty — but every investor’s situation is different.”
— multiple institutional research reports
📌 Key Takeaways
- 📉 Gold’s short-term drop is driven by high rates making competing assets more attractive — not by gold losing its structural value
- 🌍 Central banks are buying gold at the fastest pace since the 1960s, creating a structural price floor
- ⚠️ U.S. Treasuries: short-term T-bills = low risk. Long-term bonds = significant interest rate risk (prices move like stocks)
- 📈 In every Fed rate-cut cycle since 2001, gold delivered +24% to +36% in the 12 months following the pivot
- 🤝 Specific investment decisions depend entirely on your personal tax situation, time horizon, and risk tolerance — consult a qualified financial professional